
Modern Alerting Systems Design for Observability Teams
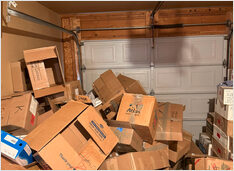
Alerting is a response system, not a noise system
Alerting gets described as a monitoring feature far too often. That framing is convenient, but it hides the real problem.
Alerting is a response system, not a noise system
Alerting gets described as a monitoring feature far too often. That framing is convenient, but it hides the real problem.
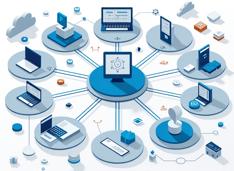
Chat platforms as control planes for systems
Chat platforms have evolved far beyond messaging tools. In modern systems they operate as interfaces between automated processes and human decision making.
Turn Discord into a safe, interactive alert bus.
Discord becomes a serious integration surface when you treat it like one: a place where systems publish events, humans make decisions, and automation continues the workflow.
Slack is a workflow UI and alert delivery layer.
Slack integrations look deceptively easy because you can post a message in one HTTP call. The interesting part starts when you want Slack to be interactive and reliable.

Install TGI, ship fast, debug faster
Text Generation Inference (TGI) has a very specific energy. It is not the newest kid in the inference street, but it is the one that already learned how production breaks -
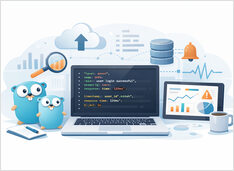
Queryable JSON logs that connect to traces.
Logs are a debugging interface you can still use when the system is on fire. The problem is that plain text logs age poorly: as soon as you need filtering, aggregation, and alerting, you start parsing sentences.

Most local AI setups start with a model and a runtime.
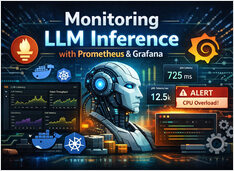
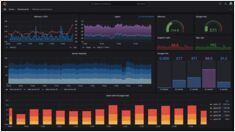
Monitor LLM with Prometheus and Grafana
LLM inference looks like “just another API” — until latency spikes, queues back up, and your GPUs sit at 95% memory with no obvious explanation.
Run Garage in Docker in minutes
Garage is an open-source, self-hosted, S3-compatible object storage system designed for small-to-medium deployments, with a strong emphasis on resilience and geo-distribution.

Metrics, dashboards, logs, and alerting for production systems — Prometheus, Grafana, Kubernetes, and AI workloads.
Observability is the foundation of reliable production systems.
Without metrics, dashboards, and alerting, Kubernetes clusters drift, AI workloads fail silently, and latency regressions go unnoticed until users complain.
Set up robust infrastructure monitoring with Prometheus
Prometheus has become the de facto standard for monitoring cloud-native applications and infrastructure, offering metrics collection, querying, and integration with visualization tools.
Master Grafana setup for monitoring & visualization
Grafana is the leading open-source platform for monitoring and observability, transforming metrics, logs, and traces into actionable insights through stunning visualizations.